FAE


Hi, I'm Fae!
Hi, I'm Fae!
User Researcher
HTML5/CSS3 Mastery
Product Design
Branding
Collaborative Team Player
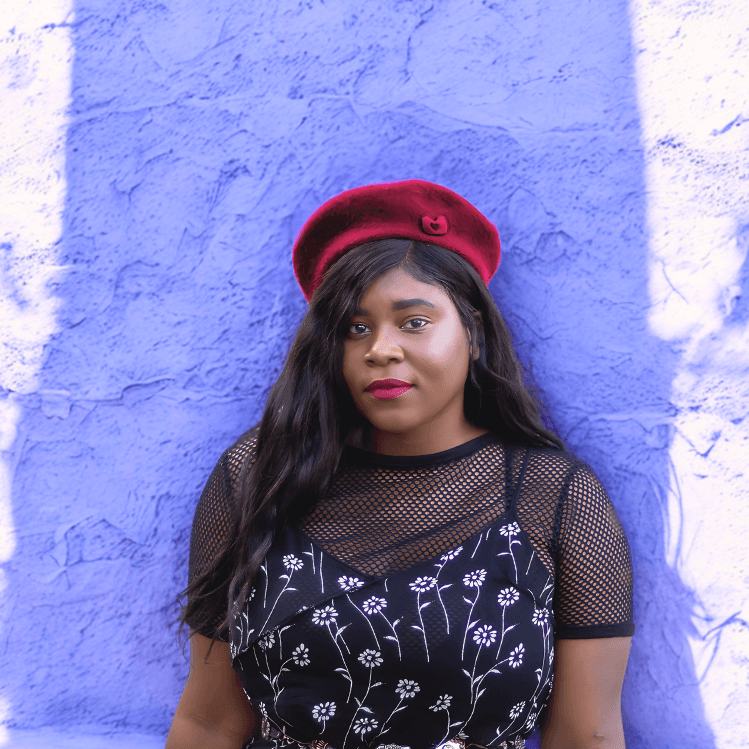


I’m a mixed-methods researcher with 7+ years of experience across consumer and SaaS products. I run Voice of the Customer research that improves onboarding, adoption, and value communication. I translate feedback, usability findings, and market context into decisions teams can ship, with clear next steps.
I’m a mixed-methods researcher with 7+ years of experience across consumer and SaaS products. I run Voice of the Customer research that improves onboarding, adoption, and value communication. I translate feedback, usability findings, and market context into decisions teams can ship, with clear next steps.
Work

Kind words from collaborators
Nice Words
Nick Ciambrello
Global Director of Onboarding & Scaled Customer Success, Semrush
"Fae is one of the most thoughtful and versatile professionals I’ve worked with. She took on multiple high-impact projects — from researching churn drivers to running Voice of Customer studies — all with a level of care and intentionality that set her apart. Fae never rushed to conclusions; she thought critically and delivered meaningful, well-researched insights. Her resilience showed in how smoothly she adapted across roles and priorities, always adding value."

Brian McDonough
Head of Growth, North America at SciSports
"What stood out most was Fae's ability to tackle complex challenges with clarity and precision. In one initiative, she led early-stage qualitative research and played a key role in shaping cross-team reporting processes. Her thoughtful approach and ability to extract insights from ambiguity made a noticeable impact."

Erika Carvalho
Project Management / Operations, Semrush
"Fae brought a thoughtful, research-driven approach to improving onboarding and retention experiences. She consistently synthesized insights others missed and was a go-to collaborator across teams. Her ability to focus on nuance and detail stands out. Anyone looking for a sharp, systems-minded UX researcher or strategist would be lucky to work with her."
Nick Ciambrello
Global Director of Onboarding & Scaled Customer Success, Semrush
"Fae is one of the most thoughtful and versatile professionals I’ve worked with. She took on multiple high-impact projects — from researching churn drivers to running Voice of Customer studies — all with a level of care and intentionality that set her apart. Fae never rushed to conclusions; she thought critically and delivered meaningful, well-researched insights. Her resilience showed in how smoothly she adapted across roles and priorities, always adding value."
Brian McDonough
Head of Growth, North America at SciSports
"What stood out most was Fae's ability to tackle complex challenges with clarity and precision. In one initiative, she led early-stage qualitative research and played a key role in shaping cross-team reporting processes. Her thoughtful approach and ability to extract insights from ambiguity made a noticeable impact."
Erika Carvalho
Project Management / Operations, Semrush
"Fae brought a thoughtful, research-driven approach to improving onboarding and retention experiences. She consistently synthesized insights others missed and was a go-to collaborator across teams. Her ability to focus on nuance and detail stands out. Anyone looking for a sharp, systems-minded UX researcher or strategist would be lucky to work with her."
Skills
Usability Testing and Onboarding Research
Identify friction, comprehension gaps, and drop-off drivers to improve first-run success and activation.
Voice of the Customer Programs
Build ongoing customer insight loops from interviews, feedback, reviews, support data, and community signals.
Mixed-Methods Research
Combine qualitative depth with quantitative and behavioral data to validate patterns and reduce guesswork.
User Interviews and Concept Testing
Uncover needs, mental models, and reactions to new ideas to shape product direction and messaging.
Field Research and In-Context Validation
Test products in real environments to understand adoption barriers, workarounds, and operational constraints.
Product and Go-to-Market Research
Translate competitive context and category expectations into sharper differentiation and clearer value communication.
Synthesis and Insight Storytelling
Turn messy inputs into decision-ready insights with clear implications, risks, and recommended next steps.
Cross-Functional Decision Support
I share findings through clear readouts and working sessions that align stakeholders on decisions, and next steps.
Approach
01
Align on the decision + definition of success
01
Align on the decision + definition of success
I start by clarifying the decision we need to make, who it impacts, and how we will measure success. This keeps the work tied to a real product or business outcome not just interesting feedback.

I select the right mix of methods for the decision at hand: qualitative research to understand why, and quantitative or behavioral data to confirm patterns and measure impact. The plan is designed to deliver clear takeaways that stakeholders can act on.
02
Design a right-sized research plan
I recruit and sample intentionally so we hear from the audiences that matter most. I design the right prompts, stimuli, and tasks to test assumptions and reduce guesswork. I pay attention to both what people say and what they do.
03
Intentional Evidence Collection
I turn messy inputs into a tight set of insights that change the plan supported by proof like quotes, themes, segment differences, and directional patterns. I also call out tradeoffs, risks, and what is likely to happen if we do nothing.
04
Synthesize into a sharp narrative
I translate findings into specific recommendations: what to do next, what to stop doing, and why it matters. I connect the “so what” to outcomes like adoption, engagement, retention, and positioning clarity.
05
Translate insights into action
I share results in formats stakeholders can actually use (one-page summary, readout deck, working session) and align decision makers early so insights do not stall. I define leading indicators, check what changed, and iterate as the product and market evolve.

06
Drive Alignment + Enable Decisions
Toolkit
I use Dovetail to synthesize qualitative research into clear, actionable insight. It helps me organize interviews, observations, and open-ended feedback in a way that surfaces patterns and themes. It supports my ability to move from raw human input to structured understanding, ensuring that audience perspectives inform creative, brand, and strategic decisions without losing nuance.

Dovetail
I use Dovetail to synthesize qualitative research into clear, actionable insight. It helps me organize interviews, observations, and open-ended feedback in a way that surfaces patterns and themes. It supports my ability to move from raw human input to structured understanding, ensuring that audience perspectives inform creative, brand, and strategic decisions without losing nuance.
Dovetail
Tap to flip
I use Airtable to organize complexity. It’s where ideas, research, timelines, and moving parts come together in a way that’s flexible but structured. This is especially useful when working across creative, strategic, and operational layers at once. It allows me to track patterns, connect dots across projects.
Airtable
Tap to flip
I use Airtable to organize complexity. It’s where ideas, research, timelines, and moving parts come together in a way that’s flexible but structured. This is especially useful when working across creative, strategic, and operational layers at once. It allows me to track patterns, connect dots across projects.
Airtable
Tap to flip
I use Google Analytics to understand how people actually move through digital experiences what draws them in, where they disengage, and how behavior changes over time. It provides a reality check between intention and outcome. This tool helps me assess whether messaging, structure, and creative direction are aligning with how audiences behave in practice.

Google Analytics
I use Google Analytics to understand how people actually move through digital experiences what draws them in, where they disengage, and how behavior changes over time. It provides a reality check between intention and outcome. This tool helps me assess whether messaging, structure, and creative direction are aligning with how audiences behave in practice.
Google Analytics
Tap to flip
I use Google Analytics to understand how people actually move through digital experiences what draws them in, where they disengage, and how behavior changes over time. It provides a reality check between intention and outcome. This tool helps me assess whether messaging, structure, and creative direction are aligning with how audiences behave in practice.
Google Analytics
Tap to flip
I use Looker Studio to synthesize data into narratives that are easy to understand and act on. Rather than working directly from raw metrics, I use it to create visual dashboards that highlight patterns, shifts, and leading indicators.
It’s especially useful for translating complex information into insights that creative and non-technical teams can engage with.
Looker Studio
Tap to flip
I use Looker Studio to synthesize data into narratives that are easy to understand and act on. Rather than working directly from raw metrics, I use it to create visual dashboards that highlight patterns, shifts, and leading indicators.
It’s especially useful for translating complex information into insights that creative and non-technical teams can engage with.
Looker Studio
Tap to flip
I use Tableau when I need to explore data more deeply and uncover relationships that aren’t immediately obvious. It supports exploratory analysis helping me identify trends, anomalies, and correlations that can inform strategic decisions. This is most valuable when I’m trying to understand why something is happening, not just what is happening.
Tableau
Tap to flip
I use Tableau when I need to explore data more deeply and uncover relationships that aren’t immediately obvious. It supports exploratory analysis helping me identify trends, anomalies, and correlations that can inform strategic decisions. This is most valuable when I’m trying to understand why something is happening, not just what is happening.
Tableau
Tap to flip
I use Hotjar to observe how people actually experience digital environments. Session recordings, heat maps, and feedback tools help reveal friction, confusion, and emotional response that analytics alone can’t show. It’s particularly useful for understanding how design and messaging land at a human level not just a statistical one.
hotjar
Tap to flip
I use Hotjar to observe how people actually experience digital environments. Session recordings, heat maps, and feedback tools help reveal friction, confusion, and emotional response that analytics alone can’t show. It’s particularly useful for understanding how design and messaging land at a human level not just a statistical one.
hotjar
Tap to flip
I use Adobe Creative Cloud as a way to translate abstract ideas, narratives, and emotional direction into concrete form whether that’s visual systems, presentation materials, or conceptual mockups. This tool supports my ability to move fluidly between concept and execution.
Creative Cloud
I use Adobe Creative Cloud as a way to translate abstract ideas, narratives, and emotional direction into concrete form whether that’s visual systems, presentation materials, or conceptual mockups. This tool supports my ability to move fluidly between concept and execution.
Creative Cloud
Tap to flip
I use Adobe Creative Cloud as a way to translate abstract ideas, narratives, and emotional direction into concrete form whether that’s visual systems, presentation materials, or conceptual mockups. This tool supports my ability to move fluidly between concept and execution.
Creative Cloud
Tap to flip
I use Semrush to understand how brands and audiences show up in the digital ecosystem. It helps surface visibility patterns, search behavior, and audience intent.
I don’t treat it as an SEO-only tool, but as a way to ground creative and positioning decisions in real-world demand and behavior.
Semrush
Tap to flip
I use Semrush to understand how brands and audiences show up in the digital ecosystem. It helps surface visibility patterns, search behavior, and audience intent.
I don’t treat it as an SEO-only tool, but as a way to ground creative and positioning decisions in real-world demand and behavior.
Semrush
Tap to flip
I use Notion as a thinking and documentation space. It’s where research notes, frameworks, working ideas, and evolving concepts live. It allows me to capture insights as they emerge and refine them over time. This tool supports clarity, continuity, and reflection especially when working across long timelines or layered projects.
Notion
Tap to flip
I use Notion as a thinking and documentation space. It’s where research notes, frameworks, working ideas, and evolving concepts live. It allows me to capture insights as they emerge and refine them over time. This tool supports clarity, continuity, and reflection especially when working across long timelines or layered projects.
Notion
Tap to flip
Let’s make something incredible together!
Let’s make something incredible together!
Reach out to discuss your project, and let’s create something that resonates and inspires.
Reach out to discuss your project, and let’s create something that resonates and inspires.